# Create sample data
read <- tibble::tribble(
  ~score, ~count,
  40, 2,   47, 2,   52, 2,   26, 1,   19, 2,
  25, 2,   35, 4,   39, 1,   26, 1,   48, 1,
  14, 2,   22, 1,   42, 1,   34, 2 ,  33, 2,
  18, 1,   15, 1,   29, 1,   41, 2,   44, 1,
  51, 1,   43, 1,   27, 2,   46, 2,   28, 1,
  49, 1,   31, 1,   28, 1,   54, 1,   45, 1
)One Sample t-test
The One Sample t-test is used to compare a single sample against an expected hypothesis value. In the One Sample t-test, the mean of the sample is compared against the hypothesis value. In R, a One Sample t-test can be performed using the Base R t.test() from the stats package or the proc_ttest() function from the procs package.
Data Used
The following data was used in this example.
Normal Data
By default, the R one sample t-test functions assume normality in the data and use a classic Student’s t-test.
Base R
Code
The following code was used to test the comparison in Base R. Note that the baseline null hypothesis goes in the “mu” parameter.
# Perform t-test
stats::t.test(read$score, mu = 30)
    One Sample t-test

data:  read$score
t = 2.3643, df = 29, p-value = 0.02497
alternative hypothesis: true mean is not equal to 30
95 percent confidence interval:
 30.67928 39.38739
sample estimates:
mean of x
 35.03333
Procs Package
Code
The following code from the procs package was used to perform a one sample t-test. Note that the null hypothesis value goes in the “options” parameter.
library(procs)

# Perform t-test
procs::proc_ttest(read, var = score, options = c("h0" = 30))
$Statistics
VAR N MEAN STD STDERR MIN MAX
1 score 30 35.03333 11.66038 2.128884 14 54
$ConfLimits
VAR MEAN LCLM UCLM STD LCLMSTD UCLMSTD
1 score 35.03333 30.67928 39.38739 11.66038 9.286404 15.67522
$TTests
VAR DF T PROBT
1 score 29 2.364306 0.0249741Viewer Output:
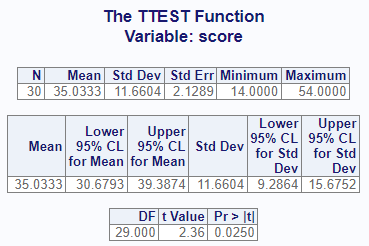
Lognormal Data
The Base R t.test() function does not have an option for lognormal data. Likewise, the procs proc_ttest() function also does not have an option for lognormal data.
Although Base R t.test() does not include a lognormal option, lognormal data can be analyzed by applying a natural log transformation to the data, performing the t-test on the log-transformed data, and exponentiating the resulting mean and confidence limits. The back-transformed mean is interpreted as the geometric mean. The standard deviation is not back-transformed.
The following example applies a natural log transformation, performs the one sample t-test on the log-transformed data, and exponentiates the mean and confidence limits.
# Apply natural log transformation to the sample data
log_score <- log(read$score)

# Perform one-sample t-test on the log-transformed data
tt <- stats::t.test(log_score, mu = log(30))

# Back-transform the geometric mean
exp(mean(log_score))
[1] 32.91447# Back-transform the confidence limits
exp(tt$conf.int)[1] 28.60623 37.87155
attr(,"conf.level")
[1] 0.95# Display p-value
tt$p.value[1] 0.1869289
NoteSession Info
─ Session info ───────────────────────────────────────────────────────────────
 setting  value
 version  R version 4.5.3 (2026-03-11)
 os       Ubuntu 24.04.4 LTS
 system   x86_64, linux-gnu
 ui       X11
 language (EN)
 collate  C.UTF-8
 ctype    C.UTF-8
 tz       UTC
 date     2026-08-25
 pandoc   3.10 @ /opt/quarto/bin/tools/ (via rmarkdown)
 quarto   1.10.18 @ /usr/local/bin/quarto

─ Packages ───────────────────────────────────────────────────────────────────
 ! package * version date (UTC) lib source
 P knitr     1.51    2025-12-20 [?] RSPM (R 4.5.0)
 P procs   * 1.0.9   2026-05-29 [?] RSPM (R 4.5.0)
 P tibble    3.3.1   2026-01-11 [?] RSPM (R 4.5.0)

 [1] /home/runner/work/CAMIS/CAMIS/renv/library/linux-ubuntu-noble/R-4.5/x86_64-pc-linux-gnu
 [2] /opt/R/4.5.3/lib/R/library

 * ── Packages attached to the search path.
 P ── Loaded and on-disk path mismatch.

──────────────────────────────────────────────────────────────────────────────