SAS Jonckheere-Terpstra Test
Background
The Jonckheere-Terpstra (JT) test is a nonparametric method designed to detect ordered differences across categories. It offers an advantageous alternative to more general tests for class differences, such as the Kruskal-Wallis test, particularly when the analysis is conducted using the WILCOXON option within the NPAR1WAY procedure. \(^{[1]}\)
The JT test is particularly well-suited for dose-response or trend analysis with ordered categorical data, where the objective is to ascertain whether an increment in dosage leads to a corresponding escalation or reduction in the response variable.\(^{[2]}\)\(^{[5]}\) Unlike other statistical evaluations that might focus on identifying isolated differences between groups, this test is specifically tailored to uncover an overarching trend within the data.
SAS Procedure
To request Jonckheere-Terpstra test, specify the JT option in the Table statement like below:
#| eval: false
proc freq;
    table Var1 * Var2 / JT;
Quit;
The JT option in the TABLES statement provides the Jonckheere-Terpstra test.
PROC FREQ also provides exact p-values for the Jonckheere-Terpstra test. You can request the exact test by specifying the JT option in the EXACT statement.\(^{[3]}\)
Data used 1
This dataset has been generated using example data which aligned with the specifications outlined in the section on the Jonckheere–Terpstra test from reference [5]. It represents the duration of hospital stays for a randomly selected group of patients across three distinct ICU departments: cardiothoracic, medical, and neurosurgical.
#| eval: false
data ICU_Stay;
    input ICU $ Stay;
    label Stay = 'Length of Stay in Days';
    datalines;
Cardiothoracic 7
Medical 4
Cardiothoracic 1
Medical 7
Cardiothoracic 2
Medical 16
Cardiothoracic 6
Medical 11
Cardiothoracic 11
Medical 21
Cardiothoracic 8
Neurosurgical 20
Neurosurgical 25
Neurosurgical 13
Neurosurgical 9
Neurosurgical 14
Neurosurgical 11
;
run;

proc sort data=ICU_Stay;
    by ICU Stay;
run;
Example Code using 1
The code performs a frequency analysis on the ‘ICU_Stay’ dataset, examining the relationship between ‘ICU’ and ‘Stay’ variables. It applies the Jonckheere-Terpstra test using JT option to identify trends in the ordered categorical ‘Stay’ variable. The output is streamlined by omitting percentages and totals for columns and rows with the ‘nopercent nocol norow’ options, emphasizing the Jonckheere-Terpstra test outcomes.
#| eval: false
proc freq data=ICU_Stay;
    table ICU * Stay / JT nopercent nocol norow;
run;
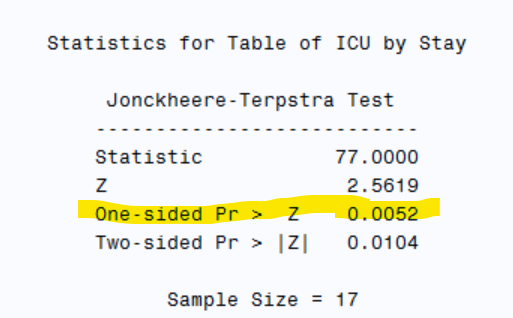
Test Result 1

Comparing this with a standard Normal distribution gives a P value of 0.005, indicating that the increase in length of stay with ICU is significant, in the order cardiothoracic, medical and neurosurgical.
Data used 2
This dataset incorporates illustrative data extracted from reference [3]. It encapsulates the responses of subjects randomly assigned to one of four treatment arms: placebo, low dosage(20mg), medium dosage(60mg), and high dosage(180mg). The variable of interest is a continuous measure. The variable ‘groupn’ is used to provide an order of ‘group’.
#| eval: false
data contin;
    input groupn group $  subject response;
    cards;
0 Placebo 01 27
0 Placebo 02 28
0 Placebo 03 27
0 Placebo 04 31
0 Placebo 05 34
0 Placebo 06 32
1 20mg 01 31
1 20mg 02 35
1 20mg 03 34
1 20mg 04 32
1 20mg 05 31
1 20mg 06 33
2 60mg 01 32
2 60mg 02 33
2 60mg 03 30
2 60mg 04 34
2 60mg 05 37
2 60mg 06 36
3 180mg 01 40
3 180mg 02 39
3 180mg 03 41
3 180mg 04 38
3 180mg 05 42
3 180mg 06 43
;
run;
Example Code using 2
The code is performing a Jonckheere-Terpstra trend test on a continuous ‘response’ variable, categorized by a ‘group’ variable, using the ‘proc freq’ procedure. The analysis is applied to the dataset named ‘contin’. The result is presented with a title “Jonckheere-Terpstra Trend Test for Continuous Data”, indicating the specific nature of the test being conducted. The ‘JT’ option is used to specify the Jonckheere-Terpstra test.
#| eval: false
proc freq data=contin;
    tables group * response/JT;
    title "Jonckheere-Terpstra Trend Test for Continuous Data";
run;
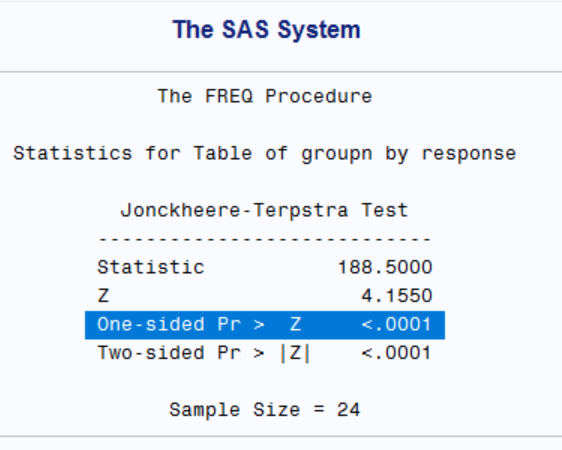
Test Result 2

There is a significant trend across different groups in the response gives a P value of <.0001.
EXACT Options
With EXACT statement, the exact version and it Monte Carlo approximation can be also conducted. However, it should be noted that the exact test, i.e., a permuation test takes a long time to compelete the task even for a small dataset.
#| eval: false
proc freq data = inds;
    title "Asymptotic p-value calculation";
    table ICU * Stay / jt;
    ods output JTTest = o_jt;
run;

proc freq data = inds;
  title "Approximation of exact test by resampling";
  table ICU * Stay / jt;
  exact jt / mc seed = 4989 n = 10000 alpha = 0.05;
  ods output JTTestMC = o_jt_sim;
run;
Conclusion
The JT test is particularly useful in scenarios such as dose-response studies in pharmacology, where the interest lies in whether increasing doses of a drug lead to a monotonic increase in the response.
Reference
[1] SAS Institute Inc. (n.d.). SAS Help Center. Retrieved August 7, 2024, from https://documentation.sas.com/doc/en/pgmsascdc/9.4_3.5/statug/statug_freq_details77.htm
[2] Pennsylvania State University. (n.d.). 11.4 - Safety and Efficacy (Phase II) Studies: Trend Analysis. In STAT 509: Advanced Statistics for the Health Sciences. Retrieved August 7, 2024, from https://online.stat.psu.edu/stat509/lesson/11/11.4
[3] SAS Institute Inc. (n.d.). FREQ Procedure: Syntax. In SAS/STAT 14.2 User’s Guide. Retrieved August 7, 2024, from https://documentation.sas.com/doc/en/pgmsascdc/9.4_3.5/statug/statug_freq_syntax08.htm
[4] Park, C., Hsiung, J.-T., Soohoo, M., & Streja, E. (2019). Choosing Wisely: Using the Appropriate Statistical Test for Trend in SAS
[5] Bewick V, Cheek L, Ball J. Statistics review 10: Further nonparametric methods. Crit Care. 2004;8(4):R131-R139. doi:10.1186/cc468904. PMCID: PMC468904.PubMed Central.