Wilcoxon Rank Sum /Mann-Whitney U test
Wilcoxon Rank Sum / Mann-Whitney U test
The Wilcoxon rank-sum test, also known as the Mann-Whitney U test, is a nonparametric test used to compare differences between two independent samples. It’s particularly useful when the sample distributions are not normally distributed and the sample sizes are small (typically less than 30).
Wilcoxon Rank Sum / Mann-Whitney U in SAS
To perform a Wilcoxon rank-sum test in SAS, you can use the PROC NPAR1WAY procedure. Here’s a step-by-step guide:
- Create the Dataset: If there are two groups (smoker and non-smoker) with their respective measurements birth weight, you can input the data as follows:
/* Create dataset */
data bw;
    input bw  grp $;
    datalines;
3.99    ns
3.89    ns
3.6     ns
3.73    ns
3.31    ns
3.7     ns
4.08    ns
3.61    ns
3.83    ns
3.41    ns
4.13    ns
3.36    ns
3.54    ns
3.51    ns
2.71    ns
3.18    s
2.74    s
2.9     s
3.27    s
3.65    s
3.42    s
3.23    s
2.86    s
3.6     s
3.65    s
3.69    s
3.53    s
2.38    s
2.34    s
;
run;- Perform the Wilcoxon rank-sum Test: Use the PROC NPAR1WAY procedure to perform the test. The wilcoxon option specifies that you want to perform the Wilcoxon rank-sum test. When computing the asymptotic Wilcoxon two-sample test, PROC NPAR1WAY uses a continuity correction by default. If specify the CORRECT=NO option in the PROC NPAR1WAY statement, the procedure does not use a continuity correction. Typically, we will also want the Hodges-Lehman confidence intervals. To get these you will need to add
hlto the pro npar1way statement.
/* Perform Wilcoxon rank-sum test - with continuity correction by default*/
proc npar1way data=BW wilcoxon hl;
    class grp;
    var bw;
run;

/* Perform Wilcoxon rank-sum test - without continuity correction*/
proc npar1way data=BW wilcoxon CORRECT=NO hl;
    class grp;
    var bw;
run;
Results
Wilcoxon rank-sum test - with continuity correction by default
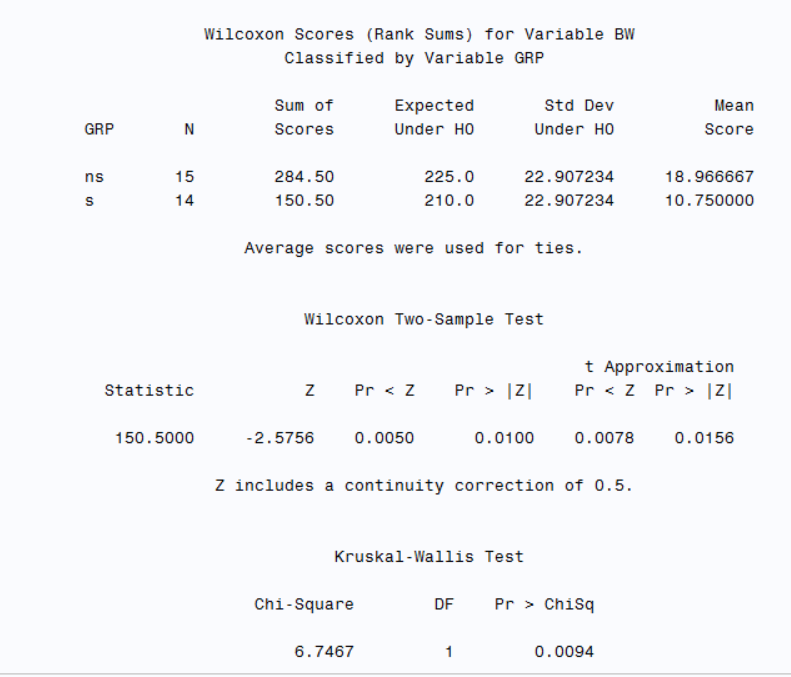
As seen above, SAS outputs a table of Wilcoxon Scores for birth weight by non-smoker and smoker: the number (N); the sum of scores; the expected sum of scores under the null hypothesis; the standard deviation under the null hypothesis, and the observed mean score. The table also includes a footnote to specify that ties were handled by using the average score.
SAS also outputs a table of Wilcoxon Two-sample Test. This table includes a footnote to specify that a continuiity correction of 0.5 is used.
Statistic: 150.5000
Z: -2.5756 (This is the test statistic after applying a continuity correction of 0.5)
Pr < Z: 0.0050 (This is the one-tailed p-value). The one-tailed p-value (Pr< Z) of 0.0050 suggests that there is a 0.5% chance of observing a test statistic as extreme as 1.2498 under the null hypothesis.
Pr > |Z|: 0.0100 (This is the two-tailed p-value). The two-tailed p-value (Pr > |Z|) of 0.0100 suggests that there is a 1.00 % chance of observing a test statistic as extreme as 1.2498 in either direction under the null hypothesis.
The t-distribution approximations provide similar p-values, indicating the robustness of the results.
t Approximation Pr < Z: 0.0078 (This is the one-tailed p-value using a t-distribution approximation)
t Approximation Pr > |Z|: 0.0156 (This is the two-tailed p-value using a t-distribution approximation)
Since the p-values (both one-tailed and two-tailed) are less than the common significance level (e.g., 0.05), we can reject the null hypothesis. This means there is a significant difference between the two groups (ns and s) for the variable BW.
Wilcoxon rank-sum test - without continuity correction
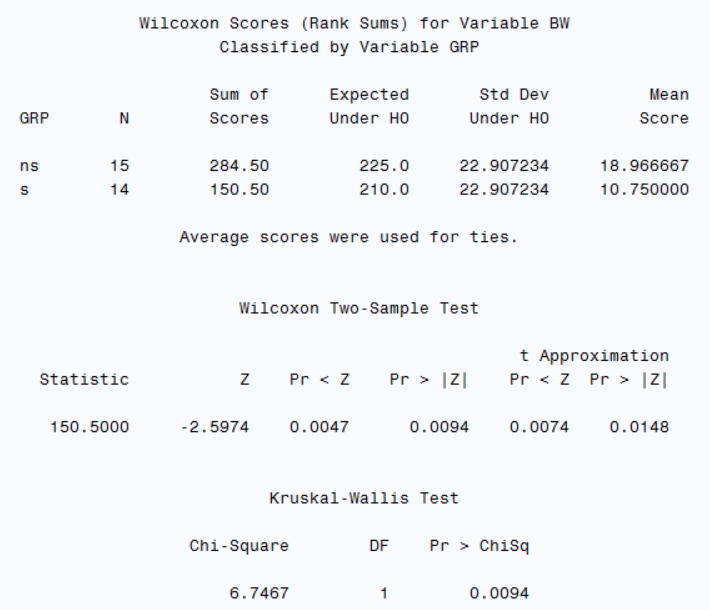
As seen above, Wilcoxon Two-Sample Test results are changed because No continuity correction is used.
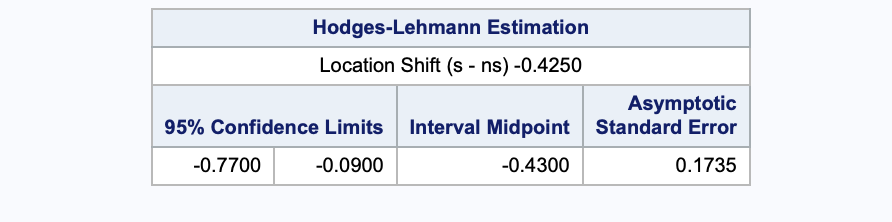
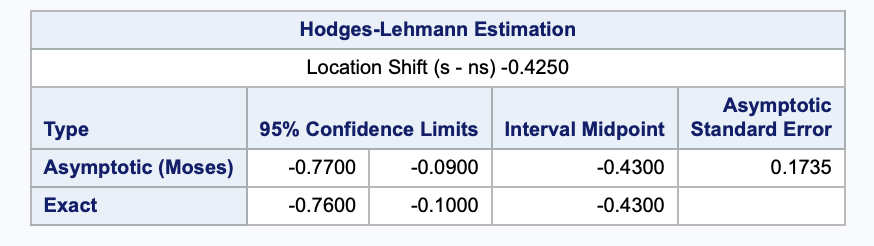
Hodges-Lehman
The correction does not effect the Hodges-Lehman CI. The Location shift is the Hodges-Lehmann estimator. By default the asymptotic (Moses) CI is shown.
Wilcoxon rank-sum test - Exact
For sufficiently small sample size, the large-sample normal approximation used by the asymptotic Wilcoxon might not be appropriate, so the exact statement is needed.
/* Perform Wilcoxon rank-sum test - with continuity correction by default*/
proc npar1way data=BW wilcoxon CORRECT=NO hl;
    class grp;
    var bw;
    exact wilcoxon hl;
run;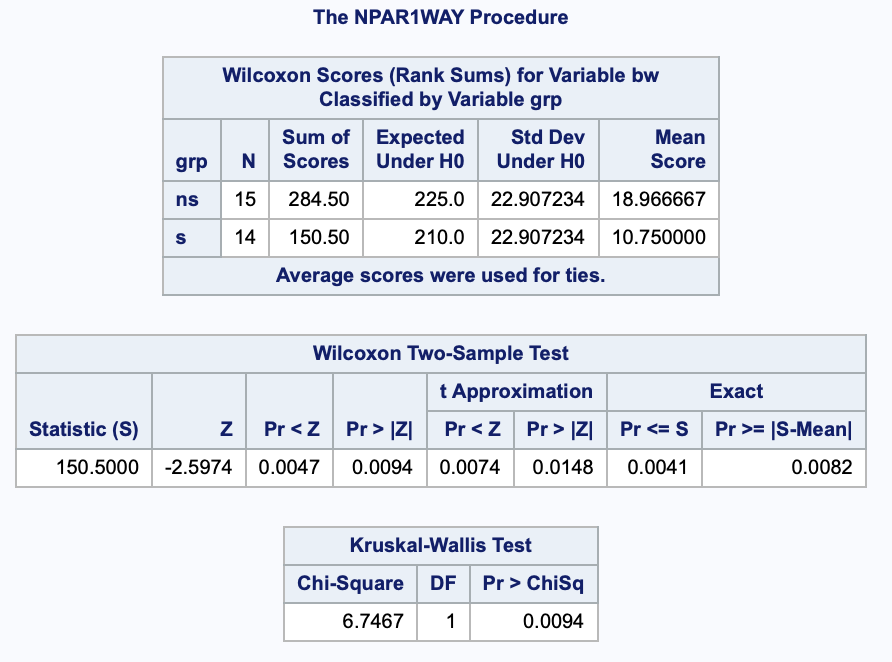
The exact hl part of that statement makes the exact and asymptotic Hodges-Lehmann CI appear.
References
SAS Help Center: TWOSAMPLEWILCOXON Statement SAS Help Center: Overview: NPAR1WAY Procedure
Data source: Table 30.4, Kirkwood BR. and Sterne JAC. Essentials of medical statistics. Second Edition. ISBN 978-0-86542-871-3