Restricted Mean Survival Time (RMST) in SAS
Under the situation where you time to event outcome has non-proportional hazards over time, the commonly used Cox Proportional Hazards regression analysis and the log-rank test can be invalid - especially when the survival curves are crossing. One alternative is to analyse the Restricted Mean Survival Time (RMST).
There are a few ways in SAS to estimate the RMST. A parametric approach is to use general estimating equations(GEE) modelling using linear or log-linear link functions and the IPCW or pseudo-value approach as described in Methods 1 and 2 below. Alternatively you can use a non-parametric approach using an Area Under the Curve (AUC) calculated for the Kaplan-Meier curves.
For treatment comparisons, the RMST can be compared across treatments and it was recommended by the FDA in draft guidance in 2020 for analysis of Acute Myeloid Leukemia (AML) here. AML commonly has an initial higher rate of death following randomization, followed by a plateauing rate of death over time (Non-proportional hazards).
The main advantage of this method is its easy clinical interpretation (e.g. with an endpoint of time to death - we are measuring average time to death). The biggest disadvantage is you have to select a time at which to calculated the average over: this time is called tau. If data is not mature enough, you may get a unreliable result. In addition, one could accuse analysts of selecting tau such that you get the ‘most significant’ result in the direction you desire!
References are found at the end of this page.
Common Mistakes doing RMST in SAS
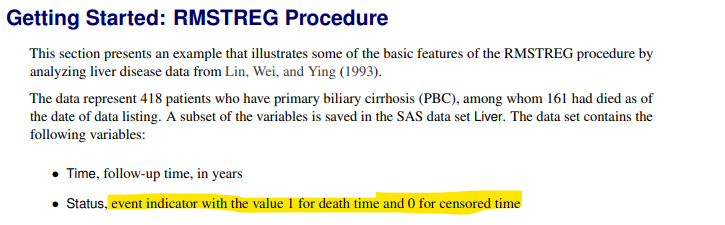
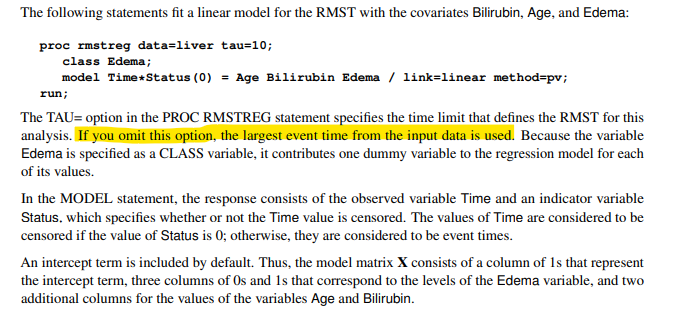
Issue 1: page 8615 of User’s Guide for RMSTREG Procedure here says it expects the event indicator (Status) to be 1=event (death time) and 0=censor. If you follow this guidance, then you must ensure that you use: model time*status(0) to ensure SAS knows that 0 is the censored observation.
A common mistake is to get the (0) or (1) indicator the wrong way around. For example, it’s common to use a cnsr variable which is set to 1=censored or 0=event. If this is used, then you must use
model time*cnsr(1)! Always make sure you check the SAS output to verify your counts of Events and Censored observations is the correct way around.
Throughout this page, we will use cnsr(1) approach.
Issue 2: page 8616 of User’s Guide for RMSTREG Procedure here tells us that if we omit the option tau=xx then SAS sets tau using the largest event time. However, what SAS actually does is use the largest time from either events or censored observations.
The selection of tau for RMST analysis is very important. It’s the period of time the average (or AUC for proc lifetest) is calculated over. If events are no longer occurring on both treatment groups, then you may not be looking at the key time period of interest. Therefore, it is better practice, to calculate tau yourself and set this as an option in the SAS code, (commonly based on the minimum time of the last event observed in each treatment group).
Data used
We are using the lung_cancer.csv dataset found here. If you tabulate the censoring flag variable cnsr
(1: censored, 0=event), we have 165 events, and 63 censored values.
We only need the variables listed below
time - Time(days) to event
cnsr - 1=censored, 0=event
age - Age of subject
sex - 1=male, 2 = female
trt01pn - 1=Active, 2=Placebo
For example:
| time | cnsr | trt01pn | age | sex |
|---|---|---|---|---|
| 306 | 0 | 1 | 74 | 1 |
| 455 | 0 | 1 | 68 | 1 |
| 1010 | 1 | 1 | 56 | 1 |
| 210 | 0 | 1 | 57 | 1 |
View your data - Kaplan-Meier Curves
It is good practice to first view the shape of your Kaplan-Meier curves. As you can see our treatment curves are crossing at approximately 300 days.
It is very important to pre-specify your approach for selection of tau. As you can see from the curves, if we compared the period 0 to 6 months, vs 0 to 18 months, we would get very different results for the treatment comparison.
proc lifetest data=adcibc  conftype=log;
    time time*cnsr(1);
    strata trt01pn;
Run;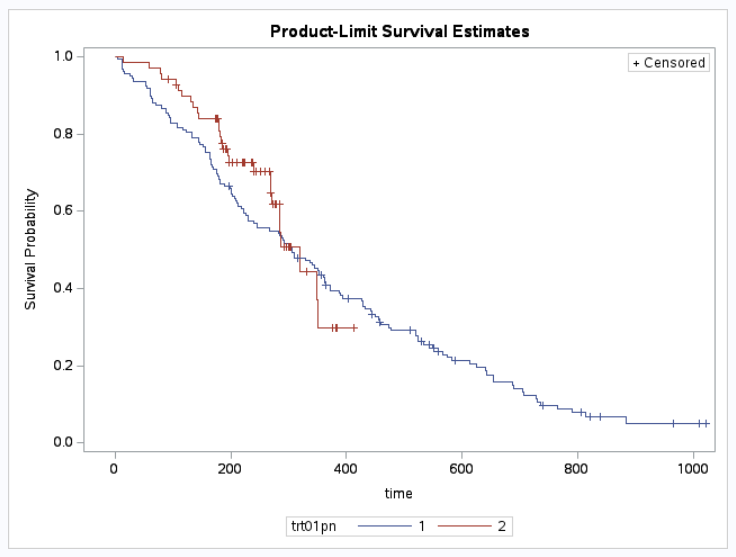
Setting tau
The code below calculates tau as the minimum time of the last event observed in each treatment group. This will be the period of time, our AUC will be calculated over. As cnsr=0 are events, we only select these observations. Below, the maximum event in treatment 1 = 883 days and in treatment 2 = 350 days. We therefore set tau = 350. This method avoids including in the AUC a period of time where events are no longer occurring in both treatments. You can see why setting tau is very important as we are likely to get very different AUCs calculating over the 350 day as opposed to the 883 day period!
proc sort data=lung_cancer (where=(cnsr=0)) out=tau1;
    by  trt01pn time;
run;

data tau1 (keep=studyid trt01pn time);
    set tau1 ;
    by trt01pn time;
    if last.trt01pn then output;
run;

proc sort data=tau1;
    by descending time;
run;

data tau2;
    set tau1 end=last;
    by descending time;
    if last then call symput("_tau",put(time,best8.));
run;

%put &_tau;
350
Method 1: Inverse Probability Censoring Weighting (IPCW) Estimation (proc rmstreg)
The Inverse probability censoring weighting estimation as per Tian L, Zhao L, Wei LJ. Biostatistics 2014, 15, 222-233 is found in SAS using Proc rmstreg and method=ipcw. This is using a generalized linear model (linear or log-linear options are available) to model right censored data over time. The estimation method uses : Generalized estimating equations (GEE).
This method uses Kaplan-Meier estimation to obtain weights and it has been shown that weighting in this way provides an unbiased estimate for an adjusted survival curve Calkins 2018. See Royston & Parmar (2013) for more detail.
To calculate the stratified weights by treatment and use them in the iterative estimation process, you need to specify strata=trt01pn
In the output, its important to check that your event/censoring flag is the right was around and tau is set as expected. (165 events and tau=335)
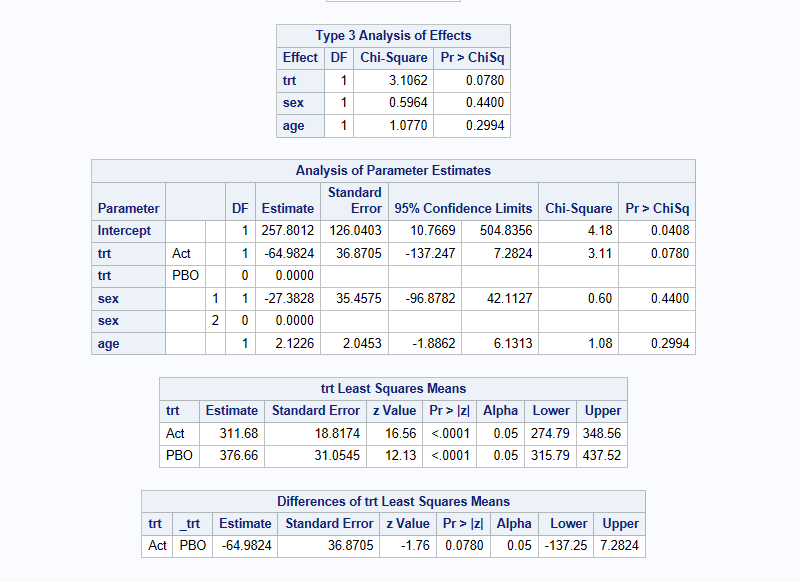
Linear link model - provides estimates of treatment differences
proc rmstreg data=adcibc tau=&_tau;
    class trt01pn sex;
    model time*cnsr(1) =trt01pn sex age /link=linear method=ipcw (strata=trt01pn);
    lsmeans trt01pn/pdiff=control('2') cl alpha=0.05;
    ods output lsmeans=lsm diffs= diff;
run;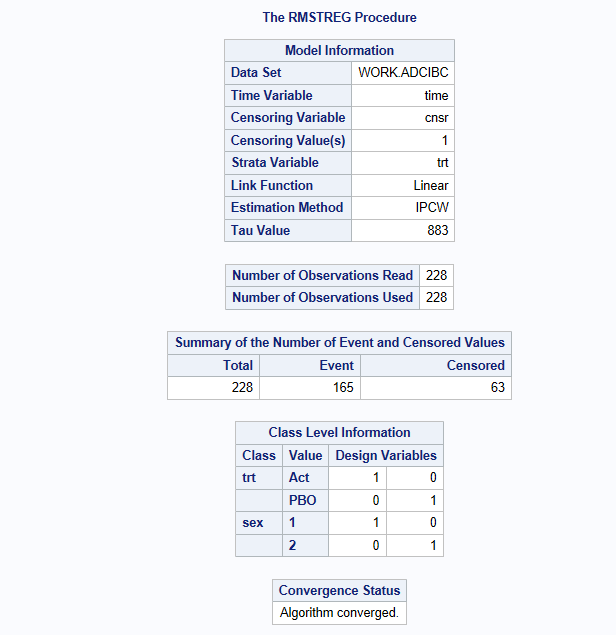
The above model results in a restricted mean survival time estimate of 257.16 days on treatment 1 vs 267.04 days on treatment 2. The difference (Active-Placebo) is -9.88 days (95% CI: -39.0 to 19.25, p=0.5061). Hence, there is no evidence of a difference between the treatments with respect to RMST when we look over the Kaplan-Meier plot from 0 to 350 days.
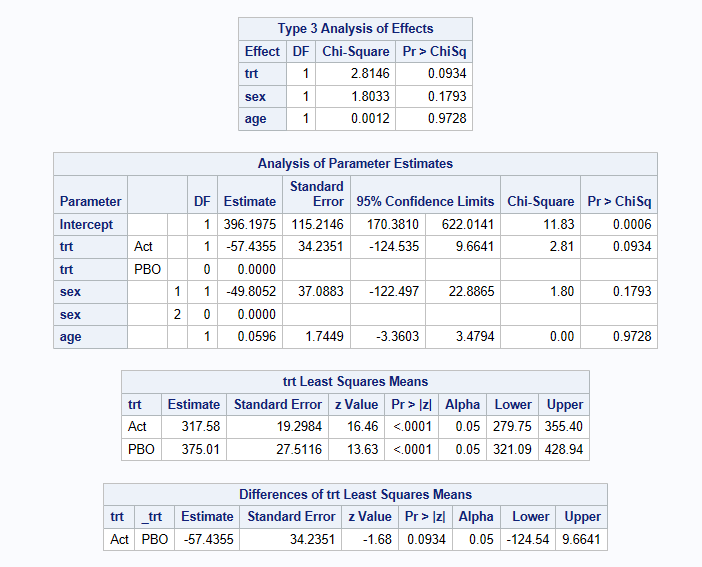
Log link model - provides estimates of treatment ratios
The code is similar to above. We include the option exp on the lsmeans row, since this back transforms (exponentiates) the estimates of the RMST (and 95% CI) for each treatment and for the treatment difference back onto the days scale (rather than log(days) scale). NOTE: if you use the ilink option and link=log method, this does the same (given the link is log), however, does not back transform the treatment differences. It is currently believed that SAS is using the delta method from the treatment arm RMSTs, to estimate the standard error for the RMST ratio.
Similar to the linear model, we obtain results of a restricted mean survival time estimate of 255.21 days on treatment 1 vs 264.75 days on treatment 2. The difference (Active-Placebo) on the log scale is -0.03667 (95% CI: -0.1493 to 0.07596, p=0.5234) but this is hard to interpret. Hence, once back transformed, the treatment ratio (Active/Placebo) is 0.9640 (95% CI: 0.8613 to 1.0789, p=0.5234).
proc rmstreg data=adcibc tau=&_tau;
    class trt01pn sex;
    model time*cnsr(1) =trt01pn sex age /link=log method=ipcw (strata=trt01pn);
    lsmeans trt01pn/pdiff=control('2') cl alpha=0.05 exp;
    ods output lsmeans=lsm diffs= diff;
run;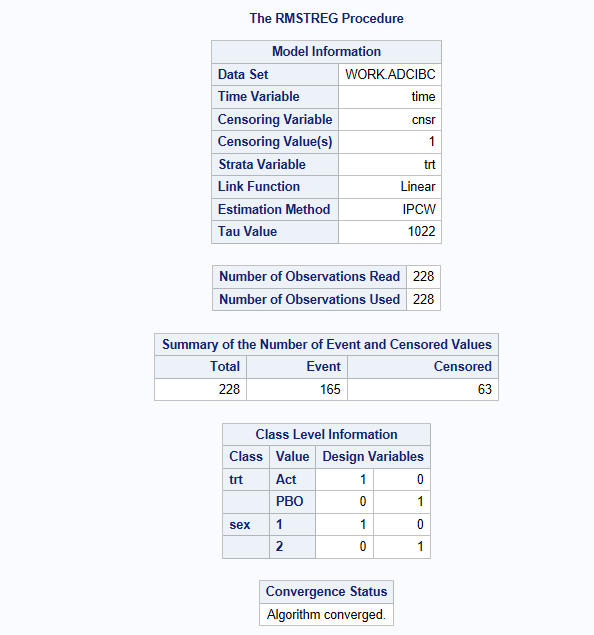
Method 2: Pseudo Value Estimation (proc rmstreg)
The pseudo-observations method Andersen, Hansen and Klein 2004, is available in SAS using the method=pv option. You use the link=linear or link=log options and output is similarly interpreted as described for Method 1 IPCW method.
proc rmstreg data=adcibc tau=&_tau;
    class trt01pn sex ;
    model time*cnsr(1) =trt01pn sex age /link=linear  method=pv;
    lsmeans trt01pn/pdiff=control('2') cl alpha=0.05;
    ods output lsmeans=lsm diffs= diff;
run;
Method 3: RMST Area under the curve method (proc lifetest)
A non-parametric method to calculate the RMST is available using the AUC Kaplan-Meier curves.
proc lifetest data=adcibc plots=(rmst  s) rmst  (tau=&_tau);
    time time*cnsr(1) ;
    strata trt01pn / diff=control('2') ;
run;
As shown below, SAS only outputs the estimates and SEs. However, a 95% CI (assuming a normal distribution) can be calculated in an additional datastep using estimate +/- 1.96 * SE.
The AUC method results in a restricted mean survival time estimate of 248.2156 days on treatment 1 vs 272.9520 days on treatment 2. The difference (Active-Placebo) is -24.7364. Calculating 95% CIs, for this results in 95% CI: -54.3971 to 4.9243, p=0.1021). Hence, there is no evidence of a difference between the treatments with respect to RMST when we look over the Kaplan-Meier plot from 0 to 350 days.
Various multiple testing p-value adjustments are also available using this method.
References
- On Biostatistics and Clinical trials Monday April 19 2021
- Royston & Parmar (2013)
- SAS User’s Guide for RMSTREG Procedure
- Analyzing RMST using SAS/STAT, Changbin Guo and Yu LIang, SAS Institute, Paper SAS3013-2019
- Huang & Kuan (2017)
- Tian L, Zhao L, Wei LJ. Biostatistics 2014, 15, 222-233
- FDA 2020 guidance and download
- Andersen, Hansen and Klein 2004
- Calkins KL, Canan CE, Moore RD, Lesko CR, Lau B. An application of restricted mean survival time in a competing risks setting: comparing time to ART initiation by injection drug use. BMC Med Res Methodol. 2018;18:27. doi: 10.1186/s12874-018-0484-z
Version
─ Session info ───────────────────────────────────────────────────────────────
 setting  value
 version  R version 4.5.2 (2025-10-31)
 os       Ubuntu 24.04.3 LTS
 system   x86_64, linux-gnu
 ui       X11
 language (EN)
 collate  en_US.UTF-8
 ctype    en_US.UTF-8
 tz       Europe/London
 date     2026-03-17
 pandoc   3.6.3 @ /home/michael/.positron-server/bin/f3aae65e0a1a11d39226cd884520f49301daef82/quarto/bin/tools/x86_64/ (via rmarkdown)

─ Packages ───────────────────────────────────────────────────────────────────
 ! package * version date (UTC) lib source
 R rmst      <NA>    <NA>       [?] <NA>

 [1] /home/michael/source/personal/CAMIS/renv/library/linux-ubuntu-noble/R-4.5/x86_64-pc-linux-gnu
 [2] /opt/R/4.5.2/lib/R/library

 R ── Package was removed from disk.

─ External software ──────────────────────────────────────────────────────────
 setting value
 SAS     9.04.01M7P08062020

──────────────────────────────────────────────────────────────────────────────