One Sample t-test in SAS
In SAS, a one sample t-test is usually performed using PROC TTEST. The one sample t-test compares the mean of the sample to a provided null hypothesis, called “h0”. The h0 value is provided as an option. By default, the h0 value is zero (0). Running the procedure produces a set of results that suggest whether or not the null hypothesis should be rejected.
Data Used
The following data was used in this example.
data read;
  input score count @@;
  datalines;
  40 2   47 2   52 2   26 1   19 2
  25 2   35 4   39 1   26 1   48 1
  14 2   22 1   42 1   34 2   33 2
  18 1   15 1   29 1   41 2   44 1
  51 1   43 1   27 2   46 2   28 1
  49 1   31 1   28 1   54 1   45 1
  ;
Normal Data
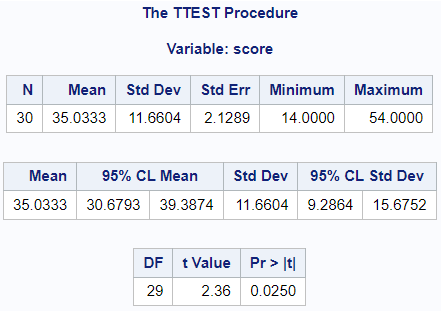
By default, SAS PROC TTEST t-test assumes normality in the data and uses a classic Student’s t-test.
Code
The following code was used to test the comparison of a reading scores against a baseline hypothesis value of 30:
proc ttest data=read h0=30;
    var score;
run;
Output:
Lognormal Data
The SAS one sample t-test also supports lognormal analysis for a one sample t-test.
Code
Using the same data as above, we will set the “DIST” option to “lognormal” to perform this analysis:
proc ttest data=read h0=30 dist=lognormal;
    var score;
run;
Output:
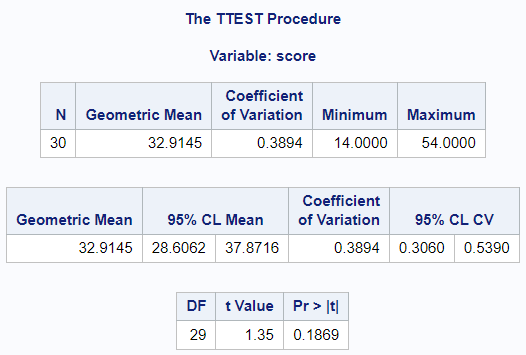
As can be seen in the figure above, the lognormal variation of the one sample TTEST provides results for geometric mean, coefficient of variation, and 95% confidence limits for the coefficient of variation.