library(emmeans)Welcome to emmeans.
Caution: You lose important information if you filter this package's results.
See '? untidy'drug_trial <- read.csv("../data/drug_trial.csv")
lm_model <- lm(formula = post ~ pre + drug, data = drug_trial)
lm_model |>
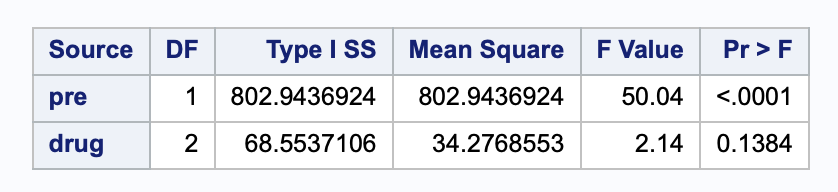
anova()Analysis of Variance Table
Response: post
Df Sum Sq Mean Sq F value Pr(>F)
pre 1 802.94 802.94 50.0393 1.639e-07 ***
drug 2 68.55 34.28 2.1361 0.1384
Residuals 26 417.20 16.05
---
Signif. codes: 0 '***' 0.001 '**' 0.01 '*' 0.05 '.' 0.1 ' ' 1