# Create sample data
d1 <- tibble::tribble(
  ~trt_grp, ~WtGain,
  "placebo",    94, "placebo",  12, "placebo",  26, "placebo",  89,
  "placebo",    88, "placebo",  96, "placebo",  85, "placebo",  130,
  "placebo",    75, "placebo",  54, "placebo",  112, "placebo", 69,
  "placebo",    104, "placebo", 95, "placebo",  53, "placebo",  21,
  "treatment",  45, "treatment",    62, "treatment",    96, "treatment",    128,
  "treatment",  120, "treatment",   99, "treatment",    28, "treatment",    50,
  "treatment",  109, "treatment",   115, "treatment",   39, "treatment",    96,
  "treatment",  87, "treatment",    100, "treatment",   76, "treatment",    80
)Two Sample t-test
Two Sample t-test in R
The Two Sample t-test is used to compare two independent samples against each other. In the Two Sample t-test, the mean of the first sample is compared against the mean of the second sample. In R, a Two Sample t-test can be performed using the Base R t.test() function from the stats package or the proc_ttest() function from the procs package.
Data Used
The following data was used in this example.
Base R
If we have normalized data, we can use the classic Student’s t-test. For a Two sample test where the variances are not equal, we should use the Welch’s t-test. Both of those options are available with the Base R t.test() function.
Student’s T-Test
Code
The following code was used to test the comparison in Base R. By default, the R two sample t-test function assumes the variances in the data are unequal, and uses a Welch’s t-test. Therefore, to use a classic Student’s t-test with normalized data, we must specify var.equal = TRUE. Also note that we must separate the single variable into two variables to satisfy the t.test() syntax and set paired = FALSE.
d1p <- dplyr::filter(d1, trt_grp == 'placebo')
d1t <- dplyr::filter(d1, trt_grp == 'treatment')

# Perform t-test
stats::t.test(d1p$WtGain, d1t$WtGain, var.equal = TRUE, paired = FALSE)
    Two Sample t-test

data:  d1p$WtGain and d1t$WtGain
t = -0.6969, df = 30, p-value = 0.4912
alternative hypothesis: true difference in means is not equal to 0
95 percent confidence interval:
 -31.19842  15.32342
sample estimates:
mean of x mean of y
  75.1875   83.1250
Welch’s T-Test
Code
The following code was used to test the comparison in Base R using Welch’s t-test. Observe that in this case, the var.equal parameter is set to FALSE. The Satterthwaite approximation is used to calculate the effective degrees of freedom.
d1p <- dplyr::filter(d1, trt_grp == 'placebo')
d1t <- dplyr::filter(d1, trt_grp == 'treatment')

# Perform t-test
stats::t.test(d1p$WtGain, d1t$WtGain, var.equal = FALSE, paired = FALSE)
    Welch Two Sample t-test

data:  d1p$WtGain and d1t$WtGain
t = -0.6969, df = 29.694, p-value = 0.4913
alternative hypothesis: true difference in means is not equal to 0
95 percent confidence interval:
 -31.20849  15.33349
sample estimates:
mean of x mean of y
  75.1875   83.1250
Procs Package
Student’s T-Test and Welch’s T-Test
Code
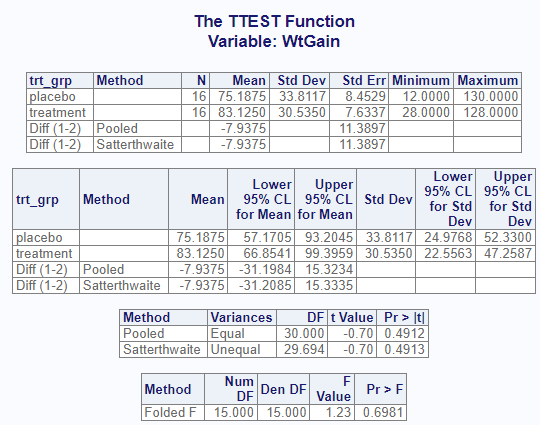
The following code from the procs package was used to perform a two sample t-test. Note that the proc_ttest() function performs both the Student’s t-test and Welch’s t-test (the Satterthwaite approximation is used to calculate the effective degrees of freedom) in the same call. The results are displayed on separate rows. This output is similar to SAS.
# Perform t-test
procs::proc_ttest(d1, var = WtGain, class = trt_grp)
$Statistics
VAR CLASS METHOD N MEAN STD STDERR MIN MAX
1 WtGain placebo <NA> 16 75.1875 33.81167 8.452918 12 130
2 WtGain treatment <NA> 16 83.1250 30.53495 7.633738 28 128
3 WtGain Diff (1-2) Pooled NA -7.9375 NA 11.389723 NA NA
4 WtGain Diff (1-2) Satterthwaite NA -7.9375 NA 11.389723 NA NA
$ConfLimits
VAR CLASS METHOD MEAN LCLM UCLM STD LCLMSTD
1 WtGain placebo <NA> 75.1875 57.17053 93.20447 33.81167 24.97685
2 WtGain treatment <NA> 83.1250 66.85407 99.39593 30.53495 22.55632
3 WtGain Diff (1-2) Pooled -7.9375 -31.19842 15.32342 NA NA
4 WtGain Diff (1-2) Satterthwaite -7.9375 -31.20849 15.33349 NA NA
UCLMSTD
1 52.33003
2 47.25868
3 NA
4 NA
$TTests
VAR METHOD VARIANCES DF T PROBT
1 WtGain Pooled Equal 30.00000 -0.6969002 0.4912306
2 WtGain Satterthwaite Unequal 29.69359 -0.6969002 0.4912856
$Equality
VAR METHOD NDF DDF FVAL PROBF
1 WtGain Folded F 15 15 1.226136 0.6980614Viewer Output:
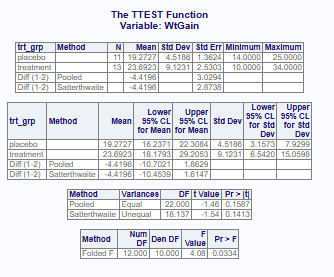
Example with unequal variances
# Create sample data
d2 <- tibble::tribble(
  ~trt_grp, ~WtGain,
  "placebo",    14, "placebo",  15, "placebo",  15, "placebo",  15,
  "placebo",    16, "placebo",  18, "placebo",  22, "placebo",  23,
  "placebo",    24, "placebo",  25, "placebo",  25,
  "treatment",  10, "treatment",    12, "treatment",    14, "treatment",    15,
  "treatment",  18, "treatment",    22, "treatment",    24, "treatment",    27,
  "treatment",  31, "treatment",    33, "treatment",    34, "treatment",    34,
  "treatment",  34,
)

d2p <- dplyr::filter(d2, trt_grp == 'placebo')
d2t <- dplyr::filter(d2, trt_grp == 'treatment')

# Perform t-test
stats::t.test(d2p$WtGain, d2t$WtGain, var.equal = FALSE, paired = FALSE)
    Welch Two Sample t-test

data:  d2p$WtGain and d2t$WtGain
t = -1.5379, df = 18.137, p-value = 0.1413
alternative hypothesis: true difference in means is not equal to 0
95 percent confidence interval:
 -10.453875   1.614714
sample estimates:
mean of x mean of y
19.27273 23.69231 procs::proc_ttest(d2, var = WtGain, class = trt_grp)$Statistics
VAR CLASS METHOD N MEAN STD STDERR MIN MAX
1 WtGain placebo <NA> 11 19.27273 4.518648 1.362424 14 25
2 WtGain treatment <NA> 13 23.69231 9.123090 2.530290 10 34
3 WtGain Diff (1-2) Pooled NA -4.41958 NA 3.029355 NA NA
4 WtGain Diff (1-2) Satterthwaite NA -4.41958 NA 2.873772 NA NA
$ConfLimits
VAR CLASS METHOD MEAN LCLM UCLM STD
1 WtGain placebo <NA> 19.27273 16.23706 22.308396 4.518648
2 WtGain treatment <NA> 23.69231 18.17928 29.205336 9.123090
3 WtGain Diff (1-2) Pooled -4.41958 -10.70208 1.862918 NA
4 WtGain Diff (1-2) Satterthwaite -4.41958 -10.45387 1.614714 NA
LCLMSTD UCLMSTD
1 3.157257 7.929927
2 6.542040 15.059805
3 NA NA
4 NA NA
$TTests
VAR METHOD VARIANCES DF T PROBT
1 WtGain Pooled Equal 22.00000 -1.458918 0.1587188
2 WtGain Satterthwaite Unequal 18.13738 -1.537902 0.1413355
$Equality
VAR METHOD NDF DDF FVAL PROBF
1 WtGain Folded F 12 10 4.076307 0.03338774Viewer Output:
NoteSession Info
─ Session info ───────────────────────────────────────────────────────────────
 setting  value
 version  R version 4.5.2 (2025-10-31)
 os       Ubuntu 24.04.4 LTS
 system   x86_64, linux-gnu
 ui       X11
 language (EN)
 collate  C.UTF-8
 ctype    C.UTF-8
 tz       UTC
 date     2026-07-14
 pandoc   3.8.3 @ /opt/quarto/bin/tools/ (via rmarkdown)

─ Packages ───────────────────────────────────────────────────────────────────
 ! package    * version date (UTC) lib source
 P cli          3.6.5   2025-04-23 [?] RSPM (R 4.5.0)
 P common     * 1.1.4   2025-12-08 [?] RSPM (R 4.5.0)
 P crayon       1.5.3   2024-06-20 [?] RSPM (R 4.5.0)
 P dplyr      * 1.2.0   2026-02-03 [?] RSPM (R 4.5.0)
 P fmtr         1.7.2   2026-01-25 [?] RSPM (R 4.5.0)
 P generics     0.1.4   2025-05-09 [?] RSPM (R 4.5.0)
 P glue         1.8.0   2024-09-30 [?] RSPM (R 4.5.0)
 P jpeg         0.1-11  2025-03-21 [?] RSPM (R 4.5.0)
 P lifecycle    1.0.5   2026-01-08 [?] RSPM (R 4.5.0)
 P magrittr     2.0.4   2025-09-12 [?] RSPM (R 4.5.0)
 P mvtnorm      1.3-3   2025-01-10 [?] RSPM (R 4.5.0)
 P pillar       1.11.1  2025-09-17 [?] RSPM (R 4.5.0)
 P pkgconfig    2.0.3   2019-09-22 [?] RSPM (R 4.5.0)
 P procs      * 1.0.7   2025-07-27 [?] RSPM (R 4.5.0)
 P R6           2.6.1   2025-02-15 [?] RSPM (R 4.5.0)
 P Rcpp         1.1.1   2026-01-10 [?] RSPM (R 4.5.2)
 P reporter     1.4.6   2026-02-07 [?] RSPM (R 4.5.0)
 P rlang        1.1.7   2026-01-09 [?] RSPM (R 4.5.0)
 P sasLM        0.10.7  2025-09-28 [?] RSPM (R 4.5.0)
 P stringi      1.8.7   2025-03-27 [?] RSPM (R 4.5.0)
 P tibble     * 3.3.1   2026-01-11 [?] RSPM (R 4.5.0)
 P tidyselect   1.2.1   2024-03-11 [?] RSPM (R 4.5.0)
   utf8         1.2.6   2025-06-08 [1] RSPM (R 4.5.0)
 P vctrs        0.7.1   2026-01-23 [?] RSPM (R 4.5.0)
 P withr        3.0.2   2024-10-28 [?] RSPM (R 4.5.0)
 P zip          2.3.3   2025-05-13 [?] RSPM (R 4.5.0)

 [1] /home/runner/work/CAMIS/CAMIS/renv/library/linux-ubuntu-noble/R-4.5/x86_64-pc-linux-gnu
 [2] /opt/R/4.5.2/lib/R/library

 P ── Loaded and on-disk path mismatch.

──────────────────────────────────────────────────────────────────────────────
Lognormal Data
The Base R t.test() function does not have an option for lognormal data. Likewise, the procs proc_ttest() function also does not have an option for lognormal data.
Although Base R t.test() does not include a lognormal option, lognormal data can be analyzed by applying a natural log transformation to the data, performing a two-sample t-test on the log-transformed data, and exponentiating the group means and confidence limits. The back-transformed difference is interpreted as a ratio of geometric means. The standard deviation is not back-transformed.
The following example applies a natural log transformation, performs the two-sample t-test on the log-transformed data, and exponentiates the mean and confidence limits.
# Apply natural log transformation to outcome variable
d1$log_WtGain <- log(d1$WtGain)

# Perform two-sample t-test on log-transformed data
tt <- t.test(log_WtGain ~ trt_grp, data = d1)

# Back-transform log means using exponential function
gm <- tapply(d1$WtGain, d1$trt_grp, function(x) exp(mean(log(x))))

# Back-transform confidence interval limits
ci <- exp(tt$conf.int)

# Extract p-value from t-test result
p_value <- tt$p.value