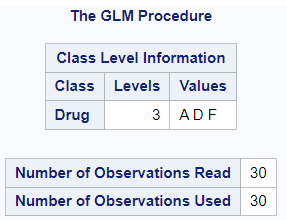
In SAS, there are several ways to perform ANCOVA analysis. One common way is to use PROC GLM with the LSMEANS option. The below example will use this method.
The following data was used in this example.
data DrugTest;
    input Drug $ PreTreatment PostTreatment @@;
    datalines;
  A 11  6   A  8  0   A  5  2   A 14  8   A 19 11
  A  6  4   A 10 13   A  6  1   A 11  8   A  3  0
  D  6  0   D  6  2   D  7  3   D  8  1   D 18 18
  D  8  4   D 19 14   D  8  9   D  5  1   D 15  9
  F 16 13   F 13 10   F 11 18   F  9  5   F 21 23
  F 16 12   F 12  5   F 12 16   F  7  1   F 12 20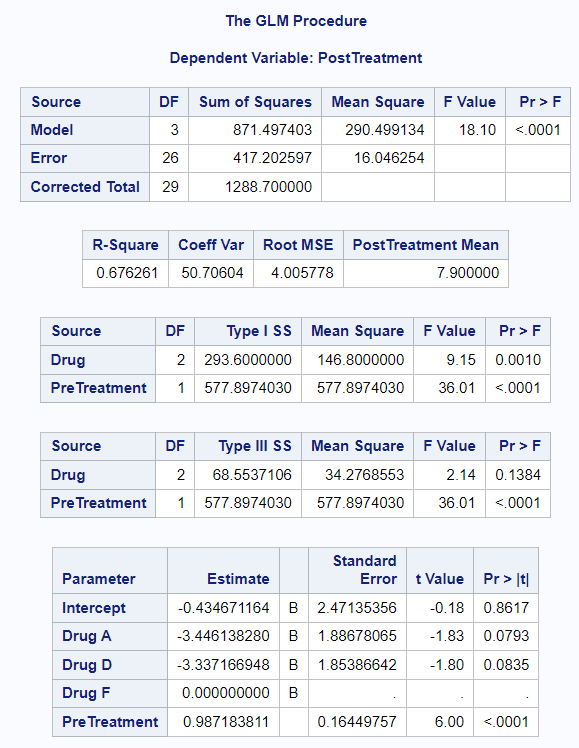
;The following code was used to test the effects of a drug pre and post treatment:
proc glm data=DrugTest;
class Drug;
model PostTreatment = Drug PreTreatment / solution;
lsmeans Drug / stderr pdiff cov out=adjmeans;
run;
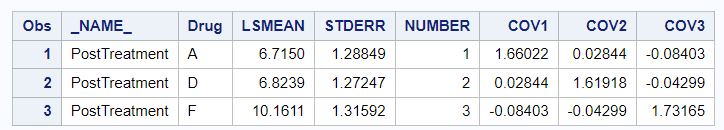
proc print data=adjmeans;
run;Output:
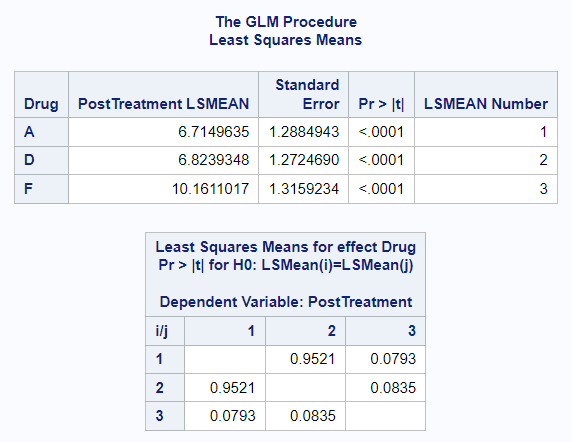
As can be seen in the images above, the GLM procedure provides multiple types of analysis to determine the relationship between the dependent and independent variables. The last step produces a table of LSMEANS and coefficient of variation values for each of the three different drugs in the dataset.