Sample size (and power) calculation – theoretical intro
Sample size calculation plays a key role in the planning stage of most clinical trials, to ensure sufficient number of subjects for providing accurate and reliable results using statistical methods. A valid sample size calculation can only be done based on the appropriate statistical test for the hypotheses that reflect the study objective under a valid study design. Sample size calculation can be classified into: sample size estimation/determination, sample size justification, sample size adjustment, sample size reestimation. We will mainly focus on the determination, which is calculation of the required sample size for achieving the desired statistical accuracy and reliability, such as e.g. 80% power.
On CAMIS we will cover most commonly used tests in clinical trials and it’s calculations in R, SAS (if available), EAST and StatXact (e.g. if not available in SAS).
Hypotheses
In most clinical trials, the primary objective is usually related to the evaluation of the effectiveness and safety. Commonly considered hypotheses include point hypotheses for equality and interval hypothesis for testing equivalence, non-inferiority and superiority.
Superiority trials aim to prove that the investigated treatment is better than the comparator. The null hypothesis states that is no difference between the treatments and the alternative that there is some difference between the treatments (difference ≠ 0).
Equivalence trials are defined as trials that test whether a drug has the same (or similar) efficacy as an active agent or standard therapy. In practice, this is done by defining an “equivalence margin”, or limits, within which the treatment effect must lie to be considered equivalent.
Non-inferiority trials aim to prove that the investigated treatment is better than the comparator.
Each of the hypotheses has different requirements for sample size to achieve the desired statistical assurance.
Study design
For examples based on superiority, equivalence and non-inferiority studies, crossover vs parallel designs will be considered. Additionally examples of sample size calculations for selected subgroup/interim analyses are provided based on group sequential designs.
A crossover (paired) design is a modified randomised block design in which each block receives more than one treatment in different dosing periods. Subjects are assigned to receive a sequence of treatments, which contains all the treatments in the study. For example, is a 2-sequence, 2-period study 2x2 crossover design, subjects are randomly assigned to one of the 2 sequences (AB, BA). The main advantage is that it allows a within-subject (intrasubject) comparison between treatments.
A parallel (unpaired) design is a complete randomised design in which each subject receives one and only one treatment in a random fashion. The parallel design doe not provide independent estimates for the subject variability for each treatment – assessment of treatment effect is made based on the total variability (including intersubject and intrasubject variability).
Required paramaters
For determination of the sample size, in most cases, all of the below parameters will be required to perform the calculations:
Power
clinically relevant/significant difference
alpha (α)
beta (β)
Effect size (Cohen’s d) (required only in some R packages), can be defined as:
Difference between the means divided by the pooled standard deviation. In general, 0.2 can be considered a small effect, 0.5 a medium effect and 0.8 a large effect.
Packages in R
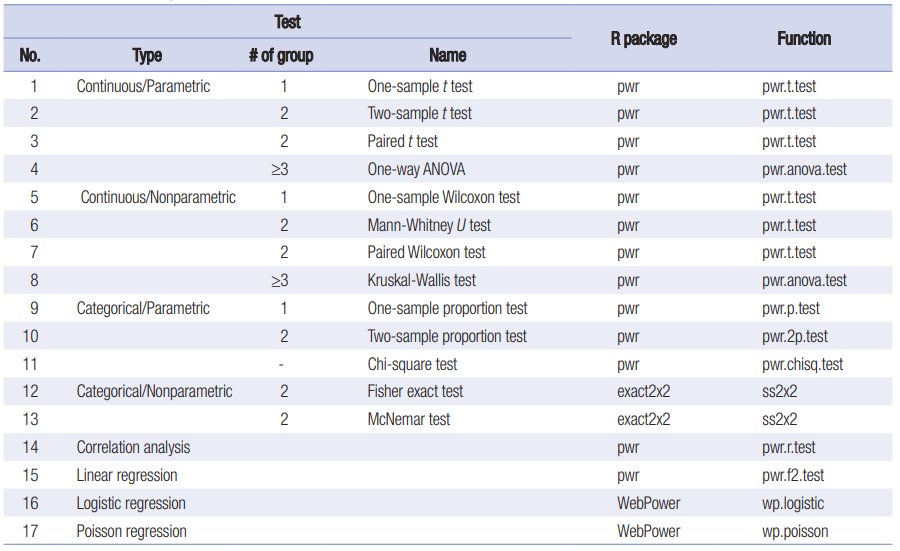
Depending on the study design and the endpoint multiple packages in R can be used. The below table [1] summarises the most popular tests and R packages where the sample size calculation is available. However, only the superiority hypothesis is considered.
There are some more interesting packages, particularly focused on clinical trials applications, with different hypotheses or designed available:
samplesize: Sample Size Calculation for Various t-Tests and Wilcoxon-Test package docs
epiR: Tools for the Analysis of Epidemiological Data package docs
TrialSize: R Functions for Chapter 3,4,6,7,9,10,11,12,14,15 of Sample Size Calculation in Clinical Research [2] package docs
SampleSize4ClinicalTrials: Sample Size Calculation for the Comparison of Means or Proportions in Phase III Clinical Trials package docs
References
[1] Park S, Kim YH, Bang HI, Park Y. Sample size calculation in clinical trial using R. J Minim Invasive Surg. 2023 Mar 15;26(1):9-18. doi: 10.7602/jmis.2023.26.1.9. PMID: 36936043; PMCID: PMC10020745.
[2] for theoretical section and examples: Chow, S.-C., Shao, J., Wang, H., & Lokhnygina, Y. (2017). Sample Size Calculations in Clinical Research (3rd ed.). Chapman and Hall/CRC. https://doi.org/10.1201/9781315183084.