library(coin)
Loading required package: survival
This section compares the wilcoxon rank-sum test.
Example: This section compares the implementation of Poisson Regression in R and SAS. Poisson regression is used to model count data and contingency tables. It’s particularly useful for modeling the number of events occurring within a fixed period of time or space.
The following table provides an overview of the support and results comparability between R and SAS for the new analysis point.
Analysis | Supported in {stats} | Supported in {coin} | Supported in SAS | Notes |
---|---|---|---|---|
Wilcoxon Rank-Sum Normal Approximation with continuity correction |
✅
|
❌ | ✅ | If there are ties in the dataset there will be a warning in {stats}, but the warning only refers to doing the exact method |
Wilcoxon Rank-Sum Normal Approximation without continuity correction |
✅ | ✅ | ✅ | |
Wilcoxon Rank-Sum Exact | ✔️ | ✅ | ✅ | {stats} can only do the exact method when no ties are present | | |||
Hodges-Lehmann CI Asymptotic |
✅ | ❌ | ✅ | |
Hodges-Lehmann CI Exact |
✔️ | ✅ | ✅ | {stats} can only do the exact method when no ties are present | | | | | | | |
This test can be run using the {stats} package, but in order to handle ties the {coin} package is recommended.
For this example we are using a dataset of birth weights for smoking and non-smoking mothers.
Data source: Table 30.4, Kirkwood BR. and Sterne JAC. Essentials of medical statistics. Second Edition. ISBN 978-0-86542-871-3
bw_ns <- c(3.99, 3.89, 3.6, 3.73, 3.31,
3.7, 4.08, 3.61, 3.83, 3.41,
4.13, 3.36, 3.54, 3.51, 2.71)
bw_s <- c(3.18, 2.74, 2.9, 3.27, 3.65,
3.42, 3.23, 2.86, 3.6, 3.65,
3.69, 3.53, 2.38, 2.34)
smk_data <- data.frame(
value = c(bw_ns, bw_s),
smoke = as.factor(rep(c("non", "smoke"), c(length(bw_ns), length(bw_s))))
)
# Relevel the factors to make it smoker - non-smokers
smk_data$smoke <- forcats::fct_relevel(smk_data$smoke, "smoke")
head(smk_data)
value smoke
1 3.99 non
2 3.89 non
3 3.60 non
4 3.73 non
5 3.31 non
6 3.70 non
This dataset is both small (so an exact test is recommended) and has ties in it.
To view the code for this see the SAS and R pages respectively.
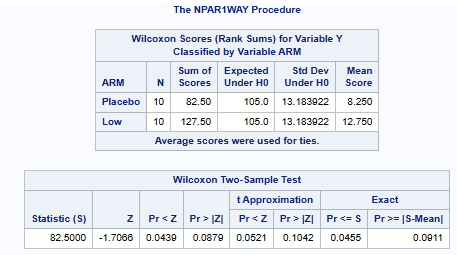
Below is a table to the p-values from the Wilcoxon Rank Sum Test with different options
Statistic | SAS Result | {stats} Results | {coin} Result | Match | Notes |
---|---|---|---|---|---|
Normal Approx with continuity correct | 0.01 | 0.01001 | ❌ | Yes | {coin} doesn’t have an option for continuity corrections |
Normal Approx without continuity correct | 0.0094 | 0.009392 | 0.009392 | Yes | |
Exact (no correction) | 0.0082 | ❌ | 0.008181 | Yes | {stats} can’t do an exact method when there are ties |
Statistic | SAS Result | {stats} Results | {coin} Result | Match | Notes |
---|---|---|---|---|---|
Asymptotic (Moses) | (-0.77, -0.09) | (-0.77, -0.090) | ❌ | Yes - only in {stats} | the exact argument in {coin} only applies to the rank-sum test |
Exact | (-0.76, -0.1) | ❌ | (-0.76, -0.10) | Yes | {stats} can’t do an exact method when there are ties |
If you have a study where you would like to use the exact wilcoxon test and there is the risk of ties, {coin} would be recommended.
Wilcoxon Rank Sum and the associated Hodges-Lehmann CI are able to be consistenly created in both SAS and R. But, it is worth noting that the test statstic of Wilcoxon Rank Sum does not directly translate into the Hodges-Lehmann CI. Because of this, the exact option in SAS and R can be slightly confusing. In SAS the exact wilcoxon hl;
statement is need to get both the exact p-value and CI. In {stats} exact values are only possible when there are no ties and the exact parameter is set to true (exact = TRUE
). This will give the exact p-value and CI. In {coin} the exact option only effects the p-values, there is no option for exact CI.
In addition to the options discussed here, there are also different method to handle ties. SAS only has one option for handling ties, the average score method. In {coin} by default ties are handled with the “mid-ranks” method.
Provide references and additional reading materials for both R and SAS documentation related to the analysis.
R Documentation:
wilcox.test
function: https://rdrr.io/r/stats/wilcox.test.html
wilcox_test
function: https://rdrr.io/cran/coin/man/LocationTests.html
SAS Documentation:
PROC npar1way
: https://documentation.sas.com/doc/en/pgmsascdc/9.4_3.4/statug/statug_npar1way_gettingstarted.htm─ Session info ───────────────────────────────────────────────────────────────
setting value
version R version 4.4.2 (2024-10-31)
os Ubuntu 24.04.2 LTS
system x86_64, linux-gnu
ui X11
language (EN)
collate C.UTF-8
ctype C.UTF-8
tz UTC
date 2025-06-06
pandoc 3.6.3 @ /opt/quarto/bin/tools/ (via rmarkdown)
─ Packages ───────────────────────────────────────────────────────────────────
! package * version date (UTC) lib source
P coin * 1.4-3 2023-09-27 [?] RSPM (R 4.4.0)
[1] /home/runner/work/CAMIS/CAMIS/renv/library/linux-ubuntu-noble/R-4.4/x86_64-pc-linux-gnu
[2] /opt/R/4.4.2/lib/R/library
P ── Loaded and on-disk path mismatch.
─ External software ──────────────────────────────────────────────────────────
setting value
SAS 9.04.01M7P080520
──────────────────────────────────────────────────────────────────────────────