R vs SAS Tipping Point (Delta Adjustment): Continuous Data
Reference-Based Multiple Imputation for Tipping Point Analysis (Delta Adjustment)
The following table shows the types of reference-based multiple imputation (rbmi) strategies used for a tipping point analysis with delta adjustments, along with each language’s capabilities and whether the results from each rbmi approach and language are consistent. The results only hold for data that are assumed to be normally distributed. In this comparison, we used the rbmi package in R and the so-called five macros in SAS.
The following assumptions are made in both languages:
Equal unstructured covariance matrix across treatment groups
Same covariates formula for the imputation and analysis model
Similar number of MCMC tuning parameters (burn-in, thinning) was used in the MCMC
The one intermittent missingness case was imputed under MAR assumption
| Analysis | Supported in R | Supported in SAS | Results Match | Notes |
|---|---|---|---|---|
| rbmi delta adjustment - MI MAR | Yes | Yes | Yes | Results will be (slightly) different given the randomness in multiple imputations |
| rbmi delta adjustment - MI MNAR Copy Reference | Yes | Yes | Yes | Results will be (slightly) different given the randomness in multiple imputations |
| rbmi delta adjustment - MI MNAR Jump to Reference | Yes | Yes | Yes | Results will be (slightly) different given the randomness in multiple imputations |
| rbmi delta adjustment - MI MNAR Copy Increments in Reference | Yes | Yes | Yes | Results will be (slightly) different given the randomness in multiple imputations |
Comparison Results
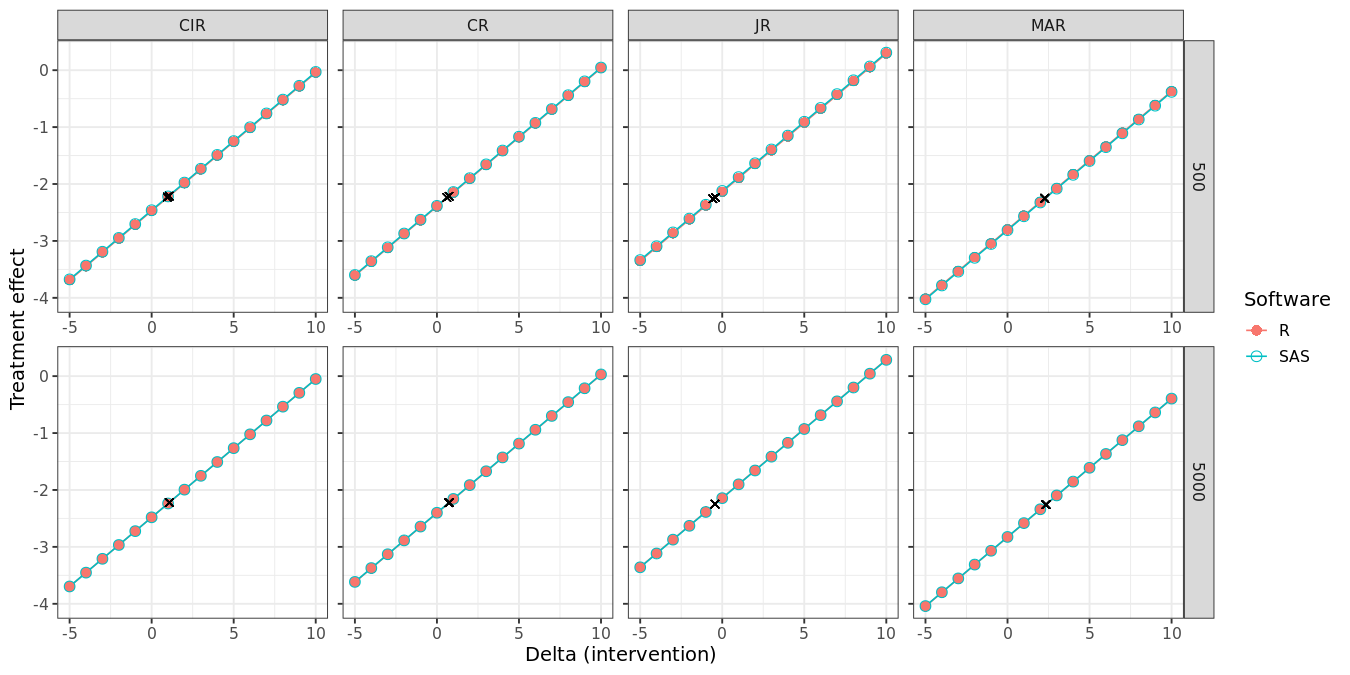
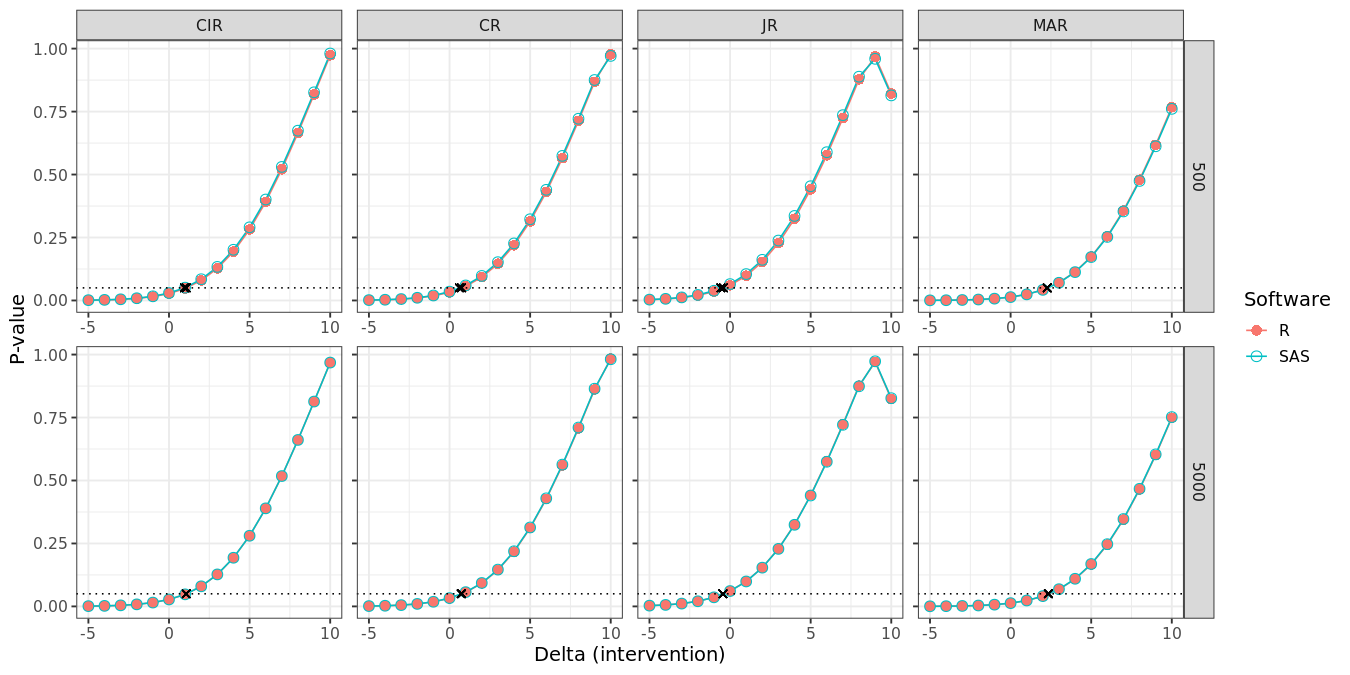
The following two figures compare the treatment effect estimates at visit 7 and corresponding p-values (y-axis) for each increasing delta in the intervention group (x-axis), while the delta adjustment in the control group is fixed to zero. The black crosses indicate exact tipping points as determined by linear interpolation. There seems to be a very good correspondence between R and SAS at M = 500, and near perfect correspondence between R and SAS at M = 5000.

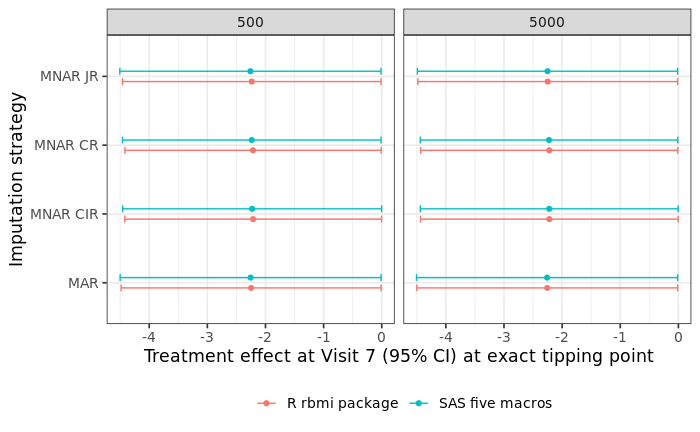
The following figure compares the treatment effect estimate at visit 7 (and associated 95% confidence interval) at the “exact” tipping point for M = 500 and M = 5000. The range of the difference between R and SAS results for the treatment effect estimates are [-1.01 to -0.37]%. and [-0.18 to -0.07]% for M = 500 and M = 5000, respectively.

MAR = Missing at Random; MNAR = Missing not at Random; JR = Jump to Reference; CR = Copy Reference; CIR = Copy Increments in Reference;
Summary and Recommendation
In our comparison of R and SAS for tipping point analysis and delta adjustments, our experience is that R offers greater flexibility in selecting which records delta adjustments should be applied to. In R, using the delta_template() function one can easily use standard dplyr coding to adjust to which records a delta adjustment and which delta adjustment should be made. Using the delta_template() function one can easily check the whether the applied delta is correct. In SAS, this is also possible using the DGroupsV and DeltaV arguments, however there is no easy way to check in intermediate datasets whether the delta adjustment is applied correctly.
In R, delta adjustments were applied to all missing data, including intermittent missing data. Whereas in SAS, intermittent missing data cannot be delta adjusted using standard code. Consequently, we would like to explicitly mention that the comparison between the two software may not be fully aligned. Still, the effect of this misalignment should be only minor (as the results show), as the explored dataset presents itself with only one intermittent missing value (patient 3618).
Nonetheless, users should be aware of the discrepancy between R and SAS in how they deal with intermittent missing values when applying delta adjustments, as it may have important implications for datasets with higher proportions of intermittent missing values. Future work on datasets with more intermittent missing data could provide more insight into this matter. For now, it is essential for statisticians to explicitly define how intermittent missing values are handled within the Statistical Analysis Plan.